

ThredUp has been on fire lately. In the past six months alone, the company’s stock price has rocketed 489%, reaching $4.20 per share. This was partly thanks to its solid quarterly results, and the run-up might have investors contemplating their next move.
Is now the time to buy ThredUp, or should you be careful about including it in your portfolio? Get the full stock story straight from our expert analysts, it’s free.
We’re glad investors have benefited from the price increase, but we don't have much confidence in ThredUp. Here are three reasons why you should be careful with TDUP and a stock we'd rather own.
Why Do We Think ThredUp Will Underperform?
Founded to revolutionize thrifting, ThredUp (NASDAQ:TDUP) is a leading online fashion resale marketplace offering a wide selection of gently-used clothing and accessories.
1. Decline in Orders Points to Weak Demand
Revenue growth can be broken down into changes in price and volume (for companies like ThredUp, our preferred volume metric is orders). While both are important, the latter is the most critical to analyze because prices have a ceiling.
ThredUp’s orders came in at 1.23 million in the latest quarter, and over the last two years, averaged 12.6% year-on-year declines. This performance was underwhelming and implies there may be increasing competition or market saturation. It also suggests ThredUp might have to lower prices or invest in product improvements to grow, factors that can hinder near-term profitability. 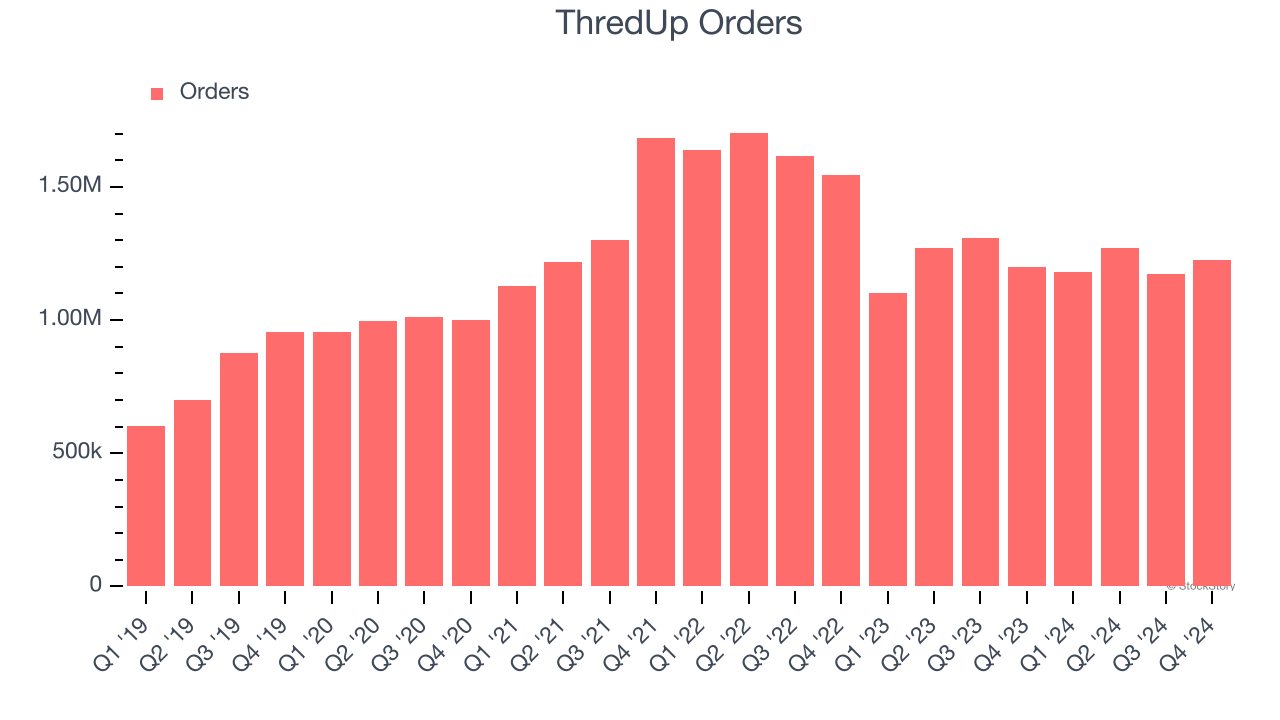
2. Operating Losses Sound the Alarms
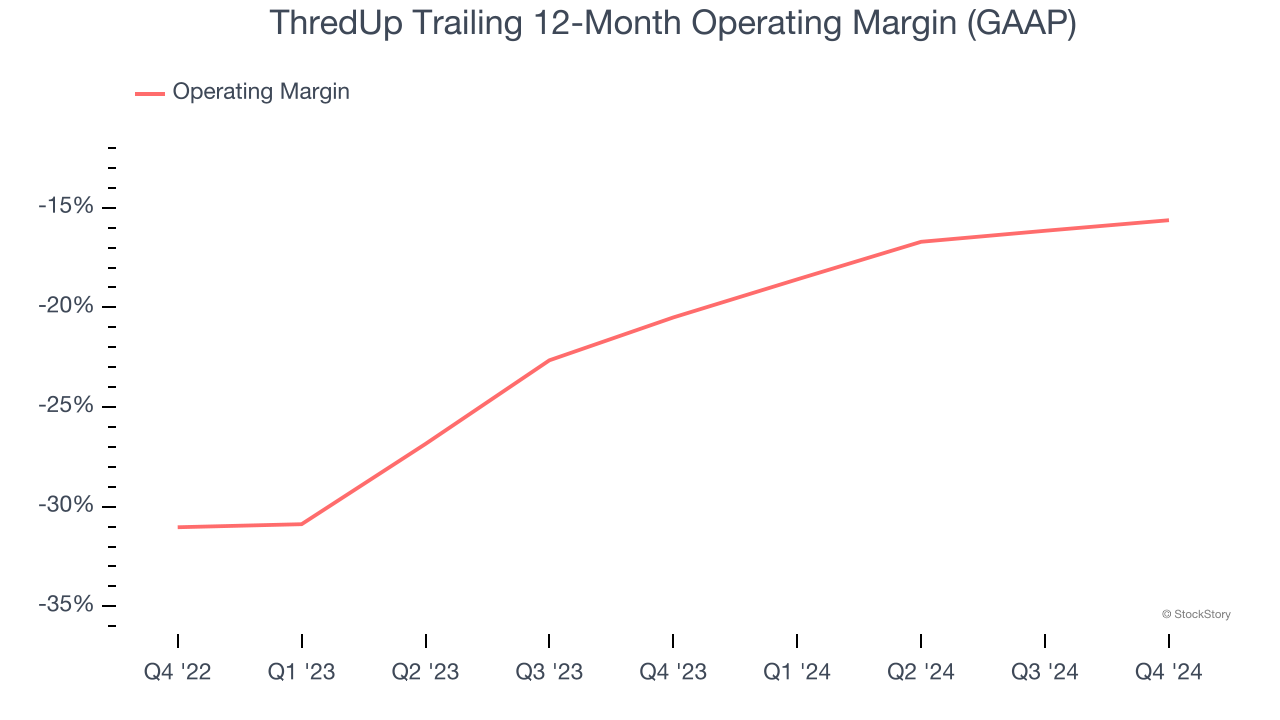
Operating margin is an important measure of profitability as it shows the portion of revenue left after accounting for all core expenses – everything from the cost of goods sold to advertising and wages. It’s also useful for comparing profitability across companies with different levels of debt and tax rates because it excludes interest and taxes.
ThredUp’s operating margin has been trending up over the last 12 months, but it still averaged negative 18.1% over the last two years. This is due to its large expense base and inefficient cost structure.
3. Cash Burn Ignites Concerns
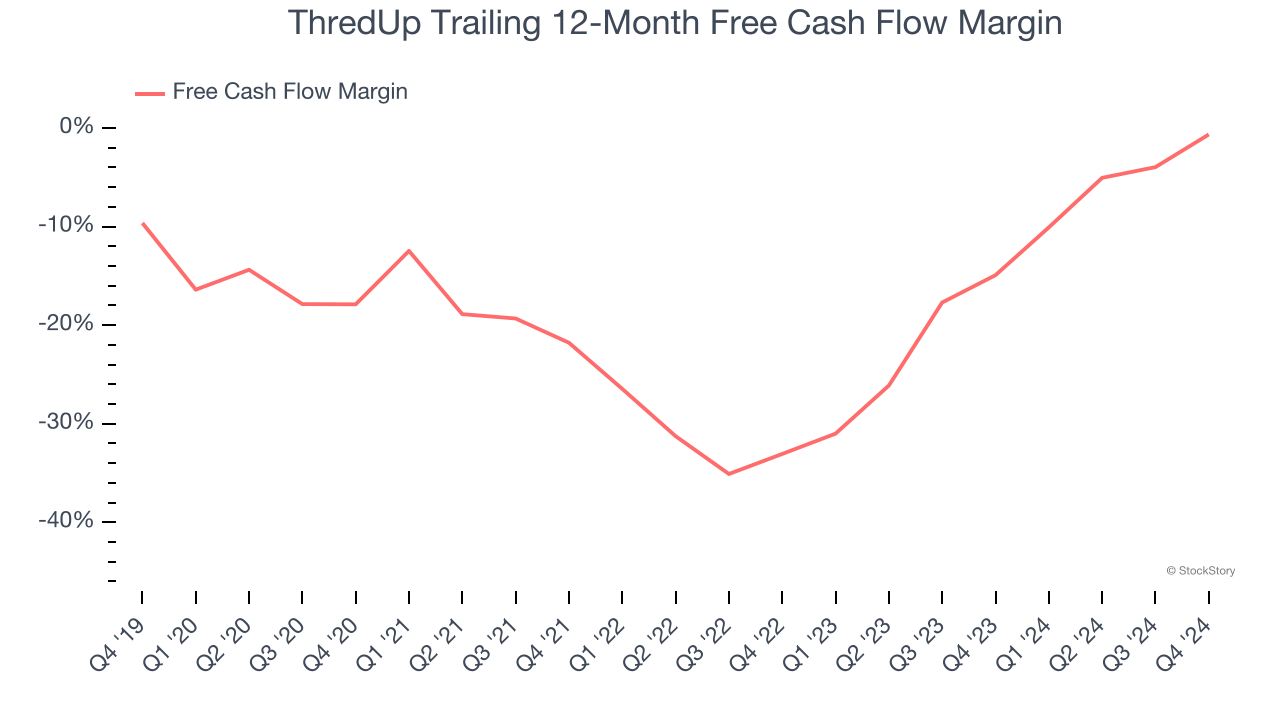
If you’ve followed StockStory for a while, you know we emphasize free cash flow. Why, you ask? We believe that in the end, cash is king, and you can’t use accounting profits to pay the bills.
Over the last two years, ThredUp’s demanding reinvestments to stay relevant have drained its resources, putting it in a pinch and limiting its ability to return capital to investors. Its free cash flow margin averaged negative 7.8%, meaning it lit $7.76 of cash on fire for every $100 in revenue.
Final Judgment
ThredUp falls short of our quality standards. Following the recent surge, the stock trades at 63.5× forward EV-to-EBITDA (or $4.20 per share). This valuation tells us it’s a bit of a market darling with a lot of good news priced in - we think there are better opportunities elsewhere. We’d recommend looking at a dominant Aerospace business that has perfected its M&A strategy.
Stocks We Would Buy Instead of ThredUp
Donald Trump’s victory in the 2024 U.S. Presidential Election sent major indices to all-time highs, but stocks have retraced as investors debate the health of the economy and the potential impact of tariffs.
While this leaves much uncertainty around 2025, a few companies are poised for long-term gains regardless of the political or macroeconomic climate, like our Top 5 Growth Stocks for this month. This is a curated list of our High Quality stocks that have generated a market-beating return of 175% over the last five years.
Stocks that made our list in 2019 include now familiar names such as Nvidia (+2,183% between December 2019 and December 2024) as well as under-the-radar businesses like Comfort Systems (+751% five-year return). Find your next big winner with StockStory today for free.